GPE_plot_map
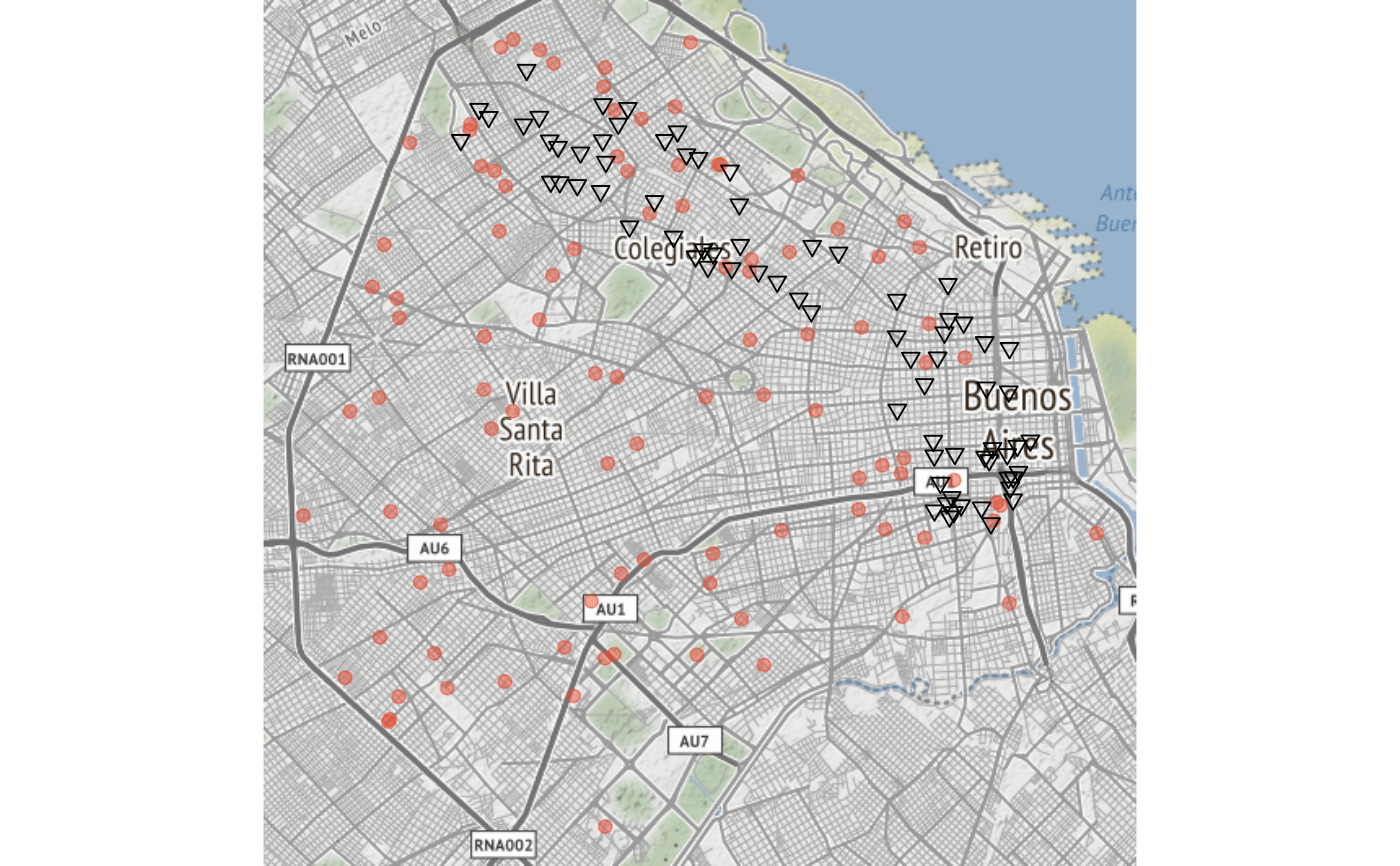
GPE_plot_map.RdPlot a map showing participants, and program locations
GPE_plot_map(participants, locations = NULL,
  participant_attribute = NA, location_attribute = NA)
Arguments
| participants | a dataframe containing "lon" and "lat" columns with WGS84 (Mercator) coordinates |
|---|---|
| locations | a dataframe containing "lon" and "lat" columns with WGS84 (Mercator) coordinates |
| participant_attribute | (optional) a participants dataframe column containing an attribute to show on the map |
| location_attribute | (optional) a locations dataframe column containing an attribute to show on the map |
Examples
GPE_plot_map(participants = participants, locations = locations)#>#>#>#>#>#>#>#>#>#>#>#>